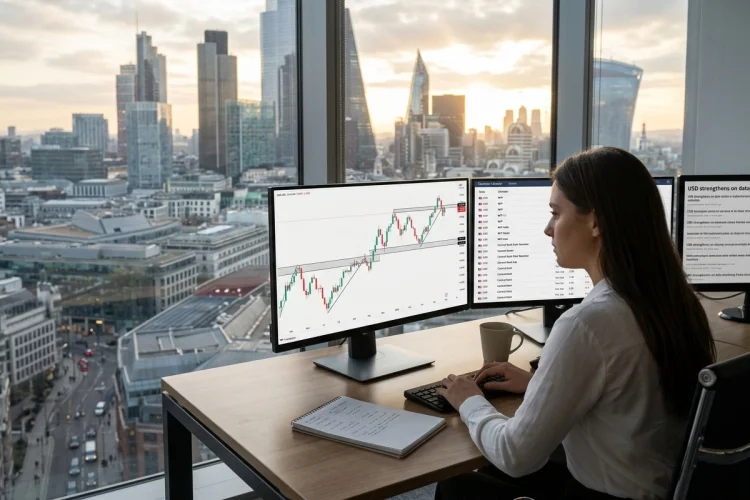
A trading chart can quickly become crowded with moving averages, oscillators, coloured signals, and complicated formulas. Price action trading takes a simpler approach: start with the price itself.
Instead of depending heavily on technical indicators, price action traders study how a market moves over time. They examine candlesticks, swing highs, swing lows, trends, support and resistance zones, breakouts, and reactions around important price levels.
So, what is price action trading? It is a method of making trading decisions primarily from current and historical price movements. The goal is not to predict every market turn perfectly.
It is to understand what buyers and sellers appear to be doing and build a structured trade around that information. This approach is widely used in forex, stocks, commodities, and other financial markets.
The forex market alone recorded average daily turnover of about US$9.6 trillion in April 2025, making it a highly active environment in which prices continuously react to orders, economic news, and changing expectations.
What Does Price Action Trading Mean?
Price action is simply the movement of an asset’s price over a period of time. It can be viewed through a line chart, bar chart, or candlestick chart.
A price action trader focuses on the information created directly by those movements. Instead of waiting for an indicator to produce a signal, the trader may look at whether the market is making higher highs, rejecting a support zone, or breaking through a previous resistance level.
Technical analysis generally uses price charts, patterns, trends, and support and resistance to study market behaviour. Price action trading belongs within this broader category, but it usually places greater emphasis on the chart itself and less emphasis on calculations derived from price.
That does not mean every price action trader completely avoids indicators. Some use one or two tools, such as a moving average, to provide context. The main trading decision, however, still comes from how the price is behaving.
How Price Action Charts Work
Most price action traders use candlestick charts because each candle provides several useful pieces of information. It shows the opening price, highest price, lowest price, and closing price for a selected period.
A one-hour candle represents one hour of trading. A daily candle summarises an entire trading day. Trading platforms may provide timeframes ranging from one minute to one month, allowing users to study short-term movements and longer market trends.
The candle’s body shows the distance between its opening and closing prices. Its upper and lower wicks reveal the highest and lowest levels reached during that period.
A long bullish body may suggest strong buying pressure. A long upper wick can indicate that buyers pushed the market higher but sellers forced it back down before the candle closed.
Individual candles are useful, but price action traders usually read them as part of a sequence. Ten candles showing steady upward progress may reveal more than one isolated bullish candle.
Market Structure: Trends, Ranges, and Reversals
Market structure describes the way price highs and lows develop over time. It helps traders decide whether the market is trending, moving sideways, or possibly changing direction.
1. Uptrends and Downtrends
An uptrend usually creates higher highs and higher lows. Buyers repeatedly push the market to new peaks, while temporary declines stop above previous major lows.
A downtrend normally produces lower highs and lower lows. Sellers remain strong enough to push the price progressively downward.
Suppose EUR/USD rises from 1.0800 to 1.0900, pulls back to 1.0850, and then advances to 1.1000. This sequence forms a higher high and a higher low, suggesting bullish structure.
Price action traders may look for buying opportunities during pullbacks in an uptrend or selling opportunities during temporary rallies in a downtrend. However, a visible trend can weaken or reverse at any time.
2. Sideways Markets
Not every market develops a clear direction. Price may move repeatedly between support and resistance, creating a trading range.
In a range, traders may watch for buying reactions near the lower boundary and selling pressure near the upper boundary. They may also wait for a decisive breakout before entering.
Support and Resistance Zones
Support is an area where declining prices have previously attracted enough buying interest to slow or reverse the fall. Resistance is an area where rising prices have previously encountered selling pressure.
Previous highs, previous lows, round numbers, trend lines, and frequently tested areas may all act as support or resistance. CME Group notes that traders commonly use earlier market highs and lows to identify levels where price may pause or change direction.
These levels should generally be treated as zones rather than exact numbers. Price may briefly move beyond a level before returning.
Imagine that GBP/USD has bounced several times from the area between 1.2500 and 1.2520. A price action trader may mark the entire region as support rather than drawing a single precise line at 1.2500.
When the market returns to that zone, the trader watches its reaction. A strong bullish candle or a long lower wick could suggest that buyers are defending the area again.
Support and resistance can also switch roles. After resistance is broken, it may become support during a later pullback. Broken support may similarly act as new resistance.
Candlestick Signals Used in Price Action
Price action traders often study candlestick formations to understand the balance between buyers and sellers. These formations should be interpreted within the wider market context rather than used as automatic signals.
1. Rejection Candles
A rejection candle has a long wick showing that the market tested a level but could not maintain it. A long lower wick near support may indicate rejection of lower prices.
For example, USD/JPY might fall below 150.00 during the trading period but recover and close well above it. This shows that sellers pushed the price lower, but buyers regained control before the close.
The signal becomes more meaningful when it appears at an established level and supports the broader market structure.
2. Engulfing Candles
A bullish engulfing candle has a body that covers the body of the previous bearish candle. It may suggest that buying pressure has suddenly overtaken selling pressure.
A bearish engulfing candle shows the opposite. A large bearish body covers the previous bullish body, indicating stronger selling activity.
Engulfing formations are not guaranteed reversal signals. They are simply evidence that short-term momentum may have changed.
3. Inside Bars
An inside bar forms when the candle’s high and low remain within the range of the previous candle. It can reflect consolidation, reduced volatility, or temporary indecision.
Some traders wait for price to break above or below the combined pattern. However, false breakouts are common, so the surrounding trend and location remain important.
Breakouts, Pullbacks, and False Breakouts
A breakout happens when price moves beyond a recognised support or resistance zone. It may indicate that the balance between buyers and sellers has changed.
Suppose EUR/USD repeatedly fails to rise above 1.1000. If it eventually closes strongly above that area, traders may interpret the move as a bullish breakout.
Entering immediately is not the only approach. Some traders wait for the price to pull back and retest the broken resistance as new support. This may provide a clearer invalidation point, although the retest does not always happen.
False breakouts occur when price moves through a level but quickly returns to the previous range. They can trap traders who enter simply because the price briefly crosses a line.
A price action trader may therefore look for confirmation through a candle close, sustained momentum, or a successful retest rather than reacting to the first small movement beyond the level.
A Simple Price Action Trading Example
Imagine that EUR/USD is in an uptrend on the four-hour chart. It has been producing higher highs and higher lows, but the price is now pulling back toward a previous resistance area around 1.0900.
That former resistance appears to be acting as support. When the price reaches the zone, it forms a candle with a long lower wick and closes near 1.0930.
The next candle moves above the high of the rejection candle. A trader may interpret this as evidence that buyers have returned.
The trader considers entering near 1.0940 and placing a stop-loss below the recent swing low at 1.0880. A possible target is the previous high at 1.1060.
The distance to the stop is 60 pips, while the potential target is 120 pips. This creates a theoretical reward-to-risk ratio of two to one.
The setup can still fail. Price action does not guarantee that the market will continue upward. Its value is that it helps the trader define an entry, invalidation point, target, and maximum planned risk before opening the position.
Price Action Trading vs Indicator-Based Trading
Indicator-based strategies use mathematical tools such as moving averages, RSI, MACD, or Bollinger Bands. These indicators process existing market data to highlight trends, momentum, or volatility.
Price action traders generally prefer to interpret raw chart movements. They may believe this provides a more direct view because most technical indicators are calculated from past or current prices.
Neither approach is automatically superior. Price action can be subjective because two traders may interpret the same chart differently. Indicators provide more specific rules, but they may produce delayed or conflicting signals.
A combined method is also possible. A trader could use price structure and support zones for the main setup while using a moving average to identify the broader trend.
Academic reviews of technical trading have produced mixed conclusions, with results varying across markets, time periods, rules, and transaction-cost assumptions. This is another reason no price-based method should be treated as consistently profitable without careful testing.
Why Economic News Still Matters
Price action trading focuses on charts, but price does not move in a vacuum. Interest-rate decisions, inflation reports, employment data, political events, and central bank announcements can cause sudden volatility.
Federal Reserve research has found that exchange rates and forex trading activity can respond very quickly to unexpected components of US economic data releases.
A technically attractive setup may therefore fail immediately after an unexpected announcement. Spreads can widen, prices may jump, and stop orders may be executed at less favourable levels.
Price action traders should know when major economic releases are scheduled. They do not necessarily need to predict the result, but they should understand that normal chart behaviour may change around important news.
Advantages and Limitations of Price Action Trading
One major advantage is simplicity. A relatively clean chart can help traders focus on trends, levels, and price reactions without being distracted by numerous indicators.
Price action can also be applied across different markets and timeframes. The same general concepts-structure, support, resistance, breakouts, and rejection—can be studied on an hourly forex chart or a daily stock chart.
The main weakness is subjectivity. Different traders may identify different trends, zones, and candlestick signals.
Historical patterns can also fail. A support level that held three times may break during the next test, while a convincing reversal candle may be followed by another strong move in the original direction.
Hindsight is another danger. Patterns often look obvious after a chart has fully developed but are much less clear in real time.
Risk Management Is More Important Than the Setup
Even an experienced price action trader will have losing trades. The goal of risk management is to prevent one incorrect interpretation from causing excessive financial damage.
Before entering, determine where the setup becomes invalid. A stop-loss should be connected to the trade idea rather than placed at a random distance.
Position size should then be calculated from the distance between the entry and stop. A wider stop normally requires a smaller position to keep the financial risk controlled.
Leverage deserves particular caution. The CFTC warns that margin-based forex trading magnifies both profits and losses, and traders may lose all their deposited margin or more depending on the account arrangement.
No candlestick pattern is strong enough to justify risking money needed for rent, emergencies, debt payments, or other essential expenses.
How Beginners Can Practise Price Action
Start with one liquid currency pair and a clear timeframe. Mark obvious swing highs, swing lows, support zones, and resistance zones.
Study what happens when the price returns to those areas. Look for rejection, consolidation, breakouts, and changes in market structure.
Use a demo account to practise placing entries, stop-losses, and targets. Keep screenshots of every setup and record why the trade was considered.
A trading journal can reveal whether your rules are consistent or whether you are changing the interpretation after seeing the result. Review a meaningful number of examples before considering real capital.
Most importantly, avoid memorising dozens of candle names without understanding context. A simple rejection candle at a major level can be more useful than a complicated pattern appearing in the middle of random market movement.
Price action trading is a method of analysing markets through their actual price movements. Traders study candlesticks, trends, swing points, support and resistance, breakouts, pullbacks, and market structure to plan possible entries and exits.
Its simplicity is appealing, but it is not an easy shortcut. Chart interpretation can be subjective, patterns regularly fail, and unexpected economic news can quickly change market conditions.
Begin with a clean chart and a small set of clearly defined concepts. Practise recognising market structure, test your rules on a demo account, and record every decision in a trading journal. Above all, decide how much you can lose before thinking about how much you might gain.